
Coaches ask us one question more than any other: "Is my conversion rate normal?" It's a smart question — you can't improve what you can't benchmark. So we pulled together the most reliable public data, including Unbounce's analysis of over 41,000 landing pages, to give you honest numbers instead of internet folklore.
One warning before the numbers: benchmarks are mirrors, not courts. A 4% application page for a $5,000 program can be a thriving funnel, while a 9% opt-in page selling a $27 ebook might be leaving half its potential on the table. Read every number below through the lens of your offer price and your traffic temperature.
Sources: Unbounce Conversion Benchmark Report (41,000+ pages) · industry CVR datasets
The numbers by industry
The all-industry median sits at 6.6%. But medians vary wildly by what you sell: online education and course pages medians run as high as 18.3%, financial services lands around 8.4%, while general SaaS struggles near 3.8%. For coaching specifically, aggregated data puts typical pages in the 3–6% range — with two huge exceptions: free consultation funnels commonly convert at 6–12%, and webinar registration pages for coaches consistently hit 15–25%.
- Free strategy call funnel: 6–12% is a healthy target.
- High-ticket application page: 3–5% is normal — the low rate hides enormous per-lead value.
- Webinar registration: aim above 20%; below 10% means the hook or the traffic is off.
- Led magnet opt-in: 20–40% is realistic when the promise is specific and the form is one field.
Where coaching funnels actually land
Across the funnels we audit, three patterns repeat. First, coaches with a specific promise ("land your first 10 clients in 90 days") convert two to three times better than coaches promising transformation in general. Second, warm audiences — email lists, retargeting pools, podcast listeners — convert 2–5x better than cold ad traffic, so segment your reporting by audience temperature before panicking. Third, the biggest single multiplier isn't copy or design: it's offer–audience fit. A perfect page selling the wrong program to the wrong crowd still converts at zero.
What "good" looks like at each funnel stage
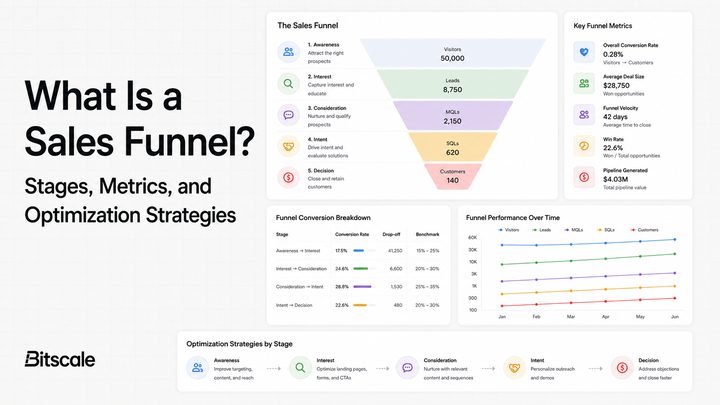
Judging a whole funnel by one number hides the real problem. Break it into stages and give each stage its own bar:
- Ad click to page load: under 2.5 seconds on mobile, or you're paying for visitors who never see your offer.
- Page visit to opt-in: use the ranges above for your funnel type.
- Opt-in to email open: 40%+ on the first email is healthy; well-built sequences reach 50%+.
- Webinar registration to live attendance: 40–50% is the industry norm (ON24 data), with replays adding 20–30% more viewers.
- Call or application to close: 15–30% for pre-sold high-ticket coaching leads; single digits usually mean the funnel promised the wrong thing.
When you know which stage is below benchmark, you know which specialist to call — and you stop paying for "more traffic" to patch a page problem.
Five moves that lift any page
Whatever your current number, these five changes produce the fastest measurable gains in our experience:
- Match the headline to the ad, word for word. Message match alone often adds 2–5 points of conversion.
- Cut to one call to action. Every extra link in the header or footer of a landing page is a leak (see why funnels fail).
- Move proof next to the button. A testimonial beside the CTA outperforms the same testimonial three scrolls up.
- Reduce form fields to the minimum viable. Email only, unless the offer genuinely needs more.
- Speed up the mobile experience. Compress images, strip heavy scripts, and test on a mid-range phone, not your laptop.
How to run a fair benchmark test on your own funnel
Numbers lie when samples are small. Before you declare your page "broken", make sure at least 300–500 visitors have seen it, that you're measuring one stage at a time, and that traffic mix hasn't shifted mid-period. Then compare against the right row of the table above — a $3,000 program page judged against a free-checklist opt-in benchmark will always feel broken when it isn't.
Frequently asked questions
What is a good conversion rate for a coaching landing page?
For free-call and lead-magnet pages, 6–12% is a solid target. Webinar registrations should exceed 20%. High-ticket application pages convert lower (3–5%) because the ask is bigger — judge them on qualified applications, not raw percentage.
My page converts below benchmark. Should I fix the page or get more traffic?
Fix the page first. More traffic into a leaking funnel just multiplies the loss. Once your conversion rate sits in the healthy range for your funnel type, scaling traffic compounds instead of burns.
How many visitors do I need before trusting my conversion rate?
At least 300–500 visitors per test period, split by traffic source. Below that, one lucky or unlucky week can swing the percentage wildly and lead you to "fix" things that were never broken.
Benchmarks are the starting line, not the trophy. If you want a page engineered to beat them — not just meet them — that's literally what we build every week. Book a free strategy call and we'll benchmark your funnel live on the call, stage by stage.